UK MOT statistics 2024: the national picture
A single reference page for the 2024 MOT result across Great Britain: how many initial car tests fail, how sharply risk rises with age, which components and severity grades appear most often, how raw rates differ by fuel, and which local conditions do — and do not — track failure rates.
What percentage of cars fail their MOT in the UK?
Initial class 4 tests finding at least one failing defect in 2024: 26.01%.
higher = larger sharecompare shares in percentage points
| Measure | Result | What it means |
|---|---|---|
| Initial tests | 52,245,925 | 52.2 million first-attempt test events |
| Initial failure rate | 26.01% | At least one major, dangerous or PRS defect was present on arrival |
| Strict fail | 20.75% | The vehicle left the initial test with a fail result |
| PRS | 5.25% | Failing defect rectified at the station before the test ended |
The common “UK” search wording needs one correction: DVSA data covers Great Britain, not Northern Ireland. These are test events rather than a count of unique cars, and PRS counts in the initial failure rate because the defect was present when the vehicle arrived. Release dvsa-2024-v1.
At what age do cars start failing their MOT more often?
The steepest year-to-year rise on the national age curve: ages 9 to 10 (+3.4 percentage points).
higher = larger sharecompare shares in percentage points
How MOT failure rate changes with car age in Britain
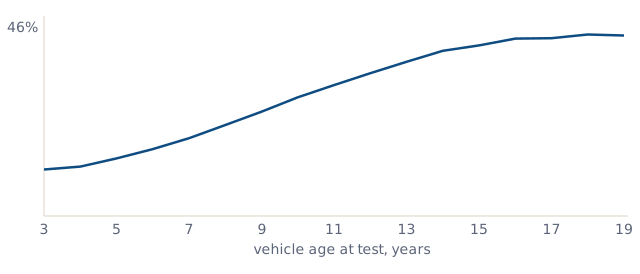
Chart axes: vehicle age at test, years · initial-failure scale 0–46%.
National failure-rate curve: data table
| Vehicle age | Initial tests | Initial failure rate |
|---|---|---|
| under 3 years | 213,118 | 7.0% |
| 3 years | 3,188,883 | 10.9% |
| 4 years | 3,128,892 | 11.6% |
| 5 years | 4,111,606 | 13.5% |
| 6 years | 4,024,959 | 15.6% |
| 7 years | 4,132,098 | 18.2% |
| 8 years | 4,214,497 | 21.3% |
| 9 years | 4,005,540 | 24.4% |
| 10 years | 3,631,798 | 27.7% |
| 11 years | 3,190,038 | 30.6% |
| 12 years | 2,704,324 | 33.4% |
| 13 years | 2,412,027 | 36.0% |
| 14 years | 2,285,007 | 38.6% |
| 15 years | 2,025,263 | 39.9% |
| 16 years | 1,781,105 | 41.5% |
| 17 years | 1,671,869 | 41.5% |
| 18 years | 1,278,035 | 42.4% |
| 19 years | 968,559 | 42.2% |
| 20+ years | 3,277,964 | 37.5% |
The curve rises from 10.9% at age three to 27.7% at ten, crossing one test in four between nine and ten. It then flattens near 42% at ages 16–19. The 20+ band is grouped and affected by survivor mix, so it is listed in the table but not joined to the single-year line. Age is descriptive, not proof that ageing alone caused each defect.
What fails an MOT most often?
The highest rate is Lamps, reflectors and electrical equipment: 23.52 per 100 tests.
higher = more defects recordeddefect items per 100 initial tests
What fails an MOT most often? National defect groups per 100 tests
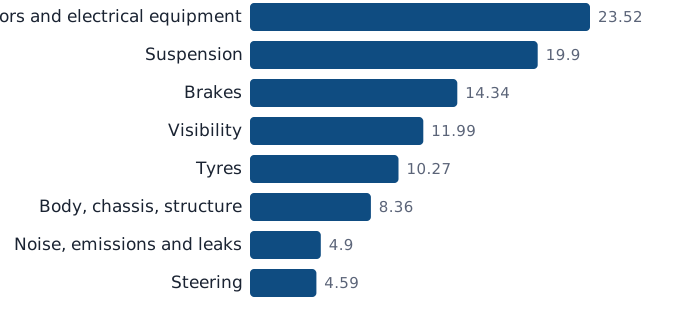
| Rank | Defect group | Failing items per 100 tests |
|---|---|---|
| 1 | Lamps, reflectors and electrical equipment | 23.52 |
| 2 | Suspension | 19.90 |
| 3 | Brakes | 14.34 |
| 4 | Visibility | 11.99 |
| 5 | Tyres | 10.27 |
| 6 | Body, chassis, structure | 8.36 |
| 7 | Noise, emissions and leaks | 4.90 |
| 8 | Steering | 4.59 |
| 9 | Seat belts and supplementary restraint systems | 1.42 |
| 10 | Identification of the vehicle | 0.62 |
A rate of 23.52 does not mean 23.52% of cars failed only on lamps: it is the number of failing items in that component group per 100 initial tests. One test can contribute several defects and several groups. Source: DVSA defect records aggregated in dvsa-2024-v1.
How serious are MOT failures? Major and dangerous defects per 100 tests
The highest value is Major defects: 63.26 per 100 tests; the lowest is Dangerous defects: 12.89 per 100 tests — a gap of 50.37 per 100 tests.
higher = more defects recordeddefect items per 100 initial tests
| Severity | Defects per 100 tests | Practical meaning |
|---|---|---|
| Major | 63.26 | May affect safety, the environment or put other road users at risk; the test fails. |
| Dangerous | 12.89 | Direct and immediate road-safety risk; the vehicle must not be driven until repaired. |
| Minor | 24.38 | Repair as soon as possible; the defect itself does not fail the test. |
Severity rates count defect items, not the share of tests receiving each label. A failed test can contain more than one major or dangerous defect, so these rows must not be read as mutually exclusive percentages.
Do diesel cars fail more MOTs than petrol or electric cars?
The highest value is Diesel: 27.67%; the lowest is Electric: 12.77% — a gap of 14.9 percentage points.
higher = larger sharecompare shares in percentage points
| Fuel | Initial tests | Initial failure rate | Vs national |
|---|---|---|---|
| Diesel | 22,037,694 | 27.67% | +1.66 pp |
| Petrol | 27,141,224 | 26.11% | +0.10 pp |
| Electric | 645,342 | 12.77% | -13.24 pp |
These are raw national rates, not like-for-like reliability scores. Electric cars are a much younger fleet, so their 12.77% row cannot establish that an electric car is less likely to fail than a petrol or diesel car of the same age. The age-adjusted fuel analysis tests that question directly.
Why are MOT failure rates higher in some parts of Britain?
The strongest relationship is MOT centre density: r=+0.57.
|r| nearer 1 = stronger relationship+ moves together · − moves in opposite directions
| Factor | Correlation | Coverage | What survived the check |
|---|---|---|---|
| MOT centre density | r=+0.57 | 119 postcode areas with station data | Higher local failure rates where there are more active test stations per 10,000 MOT-seen vehicles. |
| Urban share | r=-0.46 | 120 postcode areas with urbanisation data | More urban areas have lower raw failure rates; rural fleet age and use remain plausible confounders. |
| Within-nation deprivation (third test) | r=+0.113 | 95 English areas in the primary check | Not confirmed: it did not clear the pre-set r>0.15 threshold, so the hypothesis is closed. |
Correlation is not causation. Station density is a statement about the local testing environment, not proof that stations make cars worse; urbanisation travels with fleet age, mileage, road use and station density. Deprivation scales are not directly comparable across Britain, which is why the decisive check was conducted within nation. Environmental coverage comes from areas_env.json; the closed-hypothesis record and its three checks come from composites_area.json.
Which car models can I compare with the national MOT average?
The highest value is Citroen Berlingo: 157.7; the lowest is Land Rover Range Rover Sport: 60.3 — a gap of 97.4 index points.
below 100 = fewer failures than age predictsabove 100 = more
| Rank | Model family | Index | Raw initial failure | Initial tests |
|---|---|---|---|---|
| 1 | Land Rover Range Rover Sport | 60.3 | 14.99% | 303,232 |
| 2 | Land Rover Range Rover Evoque | 67.2 | 14.39% | 352,325 |
| 3 | Audi A5 | 71.5 | 18.06% | 241,015 |
| 4 | Audi Q3 | 72.8 | 14.57% | 226,174 |
| 5 | BMW 3 Series | 75.6 | 24.75% | 675,043 |
| 6 | Mercedes E Class | 75.8 | 19.86% | 419,012 |
| 7 | Toyota Prius | 79.4 | 19.52% | 260,089 |
| 8 | Volkswagen Tiguan | 79.8 | 15.81% | 397,745 |
| 9 | Audi A3 | 82.1 | 23.11% | 654,933 |
| 10 | Honda CR-V | 82.4 | 24.21% | 304,832 |
| 11 | Mercedes C Class | 83.6 | 22.55% | 646,907 |
| 12 | Land Rover Defender | 84.4 | 27.19% | 222,177 |
| 13 | Audi A4 | 84.6 | 25.09% | 406,182 |
| 14 | Honda e | 84.6 | 9.48% | 2,699 |
| 15 | Honda Jazz | 85.0 | 26.6% | 440,547 |
| 16 | Volkswagen Golf | 85.1 | 24.94% | 1,323,641 |
| 17 | MINI Hatch | 85.5 | 23.43% | 1,011,919 |
| 18 | Audi A1 | 91.3 | 20.41% | 386,496 |
| 19 | Ford Kuga | 91.3 | 20.4% | 396,566 |
| 20 | Mercedes A Class | 91.3 | 18.83% | 585,107 |
| 21 | Seat Leon | 92.0 | 21.49% | 296,118 |
| 22 | Skoda Octavia | 93.6 | 23.39% | 292,141 |
| 23 | Toyota Aygo | 94.9 | 23.89% | 359,723 |
| 24 | Volkswagen Passat | 95.1 | 27.82% | 277,719 |
| 25 | Toyota Yaris | 95.6 | 26.89% | 629,646 |
| 26 | Mitsubishi Outlander | 100.5·d | 21.3% | 120,823 |
| 27 | Honda Civic | 100.7 | 32.3% | 411,763 |
| 28 | Ford Mondeo | 102.5 | 32.49% | 284,784 |
| 29 | Citroen C1 | 102.9 | 30.21% | 230,618 |
| 30 | Hyundai i10 | 103.6 | 26.95% | 328,314 |
| 31 | Skoda Fabia | 105.7 | 29.3% | 323,883 |
| 32 | Volkswagen Transporter | 106.4 | 30.46% | 503,457 |
| 33 | Ford Focus | 106.9 | 31.02% | 1,348,944 |
| 34 | Kia Sportage | 107.8 | 22.55% | 396,816 |
| 35 | Volkswagen Caddy | 108.0 | 29.15% | 231,167 |
| 36 | Vauxhall Astra | 109.1 | 33.71% | 914,157 |
| 37 | Nissan Leaf | 109.2 | 17.69% | 70,882 |
| 38 | Ford Ka | 109.5 | 33.29% | 253,099 |
| 39 | Kia Picanto | 111.0 | 28.14% | 262,067 |
| 40 | Vauxhall Insignia | 111.3 | 30.4% | 300,589 |
| 41 | Nissan Micra | 112.5 | 36.12% | 342,234 |
| 42 | Volkswagen Polo | 114.8 | 32.68% | 895,817 |
| 43 | Fiat 500 | 116.2 | 31.68% | 477,588 |
| 44 | Ford Fiesta | 117.8 | 34.33% | 1,959,383 |
| 45 | Vauxhall Zafira | 118.6 | 38.47% | 281,888 |
| 46 | Nissan Qashqai | 122.9 | 30.07% | 800,602 |
| 47 | Tesla Model 3 | 122.9 | 14.03% | 116,025 |
| 48 | Vauxhall Corsa | 123.5 | 36.66% | 1,191,943 |
| 49 | Seat Ibiza | 124.2 | 32.1% | 296,654 |
| 50 | Nissan Juke | 124.7 | 28.37% | 460,457 |
| 51 | Peugeot 208 | 126.7 | 27.87% | 295,225 |
| 52 | Vauxhall Mokka | 133.5 | 27.34% | 332,738 |
| 53 | Renault Clio | 141.5 | 41.43% | 473,424 |
| 54 | DS 3 | 150.2 | 40.69% | 158,830 |
| 55 | Vauxhall Vivaro | 156.4 | 41.93% | 275,396 |
| 56 | Citroen Berlingo | 157.7 | 39.91% | 270,806 |
This is a published panel of 25 high-volume or analytically useful model families, not every model registered in Britain. Index 100.0 means the failure level expected for that family’s age mix; “·d” means its 95% interval includes 100, so no directional verdict is claimed. See the full methodology, definitions and limitations before comparing models.
Published MOT reports and downloads
- UK MOT failure rates 2024 — national figures by age and fuel, best/worst families, downloadable CSV.
- MOT failure by fuel type — whether electric cars really fail less than petrol, compared at the same age, and what they fail on instead.
New reports are added per dataset release — see the changelog.