Do electric cars fail their MOT less?
No — at the same age they fail more. Electric cars fail 10.8% of their MOTs against 20.7% for petrol, which looks decisive until you notice that the electric fleet averages 4.2 years old and the petrol fleet 10.5. Standardise for age and the ranking inverts: electric scores 111.1 where 100 is normal for the age, petrol 97.6. The clear winner is neither — it is the petrol hybrid at 70.2.
| Fuel | Index (100 = normal for age) | 95% interval | Raw % failing | Average age | Initial tests 2024 |
|---|---|---|---|---|---|
| Petrol hybrid | 70.2 | 69.9–70.5 | 9.0% | 5.9 yrs | 2,174,539 |
| Petrol | 97.6 | 97.5–97.6 | 20.7% | 10.5 yrs | 27,140,912 |
| Diesel | 104.6 | 104.5–104.7 | 22.4% | 10.3 yrs | 22,037,676 |
| Electric | 111.1 | 110.3–111.9 | 10.8% | 4.2 yrs | 729,001 |
Index is indirect standardisation: observed failures divided by the failures expected if this fuel had the national failure rate at each age. Intervals are Byar approximations on the index itself.
Same age, different fuel: where the raw numbers break
Electric cars fail more than petrol at every age from three to eleven. The gap widens with age rather than closing: 9.0% against 7.1% at three years old, 26.6% against 21.6% at ten.
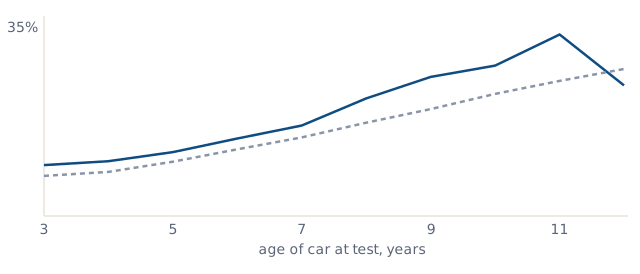
Solid line: electric, dashed line: petrol — percentage of initial tests that failed, plotted against age of car at test, years. The vertical axis runs to 35%; every plotted value is in the table below.
| Age at test | Electric % failing | Electric tests | Petrol % failing | Petrol tests |
|---|---|---|---|---|
| 3 years | 9.0% | 317,120 | 7.1% | 1,527,957 |
| 4 years | 9.7% | 196,464 | 7.8% | 1,673,928 |
| 5 years | 11.3% | 67,276 | 9.6% | 2,379,062 |
| 6 years | 13.7% | 24,888 | 11.8% | 2,223,026 |
| 7 years | 16.0% | 21,589 | 13.9% | 1,978,945 |
| 8 years | 20.8% | 15,178 | 16.5% | 1,871,387 |
| 9 years | 24.6% | 13,127 | 18.9% | 1,781,354 |
| 10 years | 26.6% | 13,213 | 21.6% | 1,610,862 |
| 11 years | 32.1% | 2,906 | 23.9% | 1,472,745 |
| 12 years | 23.1% | 4,616 | 26.0% | 1,261,504 |
What electric cars actually fail on
Tyres, and it is not close. Among cars 3–5 years old — where most of the electric fleet sits — electric cars pick up 12.48 tyre defects per 100 tests against 6.99 for petrol of the same age. That is 79% more, and tyres are the only category where electric cars come off worse. A heavier car delivering torque from a standstill wears its tyres faster, and the inspection sees it.

Tyre defects per 100 initial tests, cars 3–5 years old only.
| Defect group (per 100 tests, age 3–5) | Electric | Petrol | Diesel | Hybrid |
|---|---|---|---|---|
| Tyres | 12.48 | 6.99 | 8.23 | 7.01 |
| Visibility | 7.68 | 7.28 | 11.82 | 7.36 |
| Lamps, reflectors and electrical equipment | 2.41 | 2.54 | 6.68 | 2.32 |
| Brakes | 1.3 | 3.48 | 5.56 | 1.37 |
| Suspension | 1.71 | 1.27 | 2.5 | 0.99 |
| Body, chassis, structure | 0.36 | 0.55 | 1.82 | 0.29 |
| Noise, emissions and leaks | 0.01 | 0.65 | 1.75 | 0.19 |
| Identification of the vehicle | 0.5 | 0.39 | 0.7 | 0.39 |
Sample sizes in this window: petrol hybrid 1,215,226, petrol 5,580,947, diesel 2,938,611, electric 580,860 initial tests.
What this means if you are buying
Budget for tyres on an electric car, not for electrical faults. The failure that catches electric owners is the cheapest one to prevent and the easiest to check yourself before the test.
A used electric car is not a safer MOT bet than a used petrol one of the same age. If the seller points at a low failure rate for electric cars generally, that number is describing the age of the fleet, not the car in front of you.
If MOT outcomes are what you are optimising, the petrol hybrid is the strongest class on this data — index 70.2 across 2,174,539 tests, better than every other fuel at every age we can compare.
Where this number stops applying
This measures one thing: the chance of failing a roadworthiness inspection. It is not breakdown frequency, not repair cost and not owner-reported faults — those are different measurements and they can point the other way for the same car. Three further limits worth stating: the electric fleet is small and concentrated in a few models, so its numbers move with those models rather than with electric cars in general; cars aged eleven and over are thin on the electric side (2,906 tests at eleven) and the curve there is noisy; and hybrids here are petrol hybrids, with diesel hybrids reported separately because they behave differently.
Source: DVSA anonymised MOT tests and results, calendar 2024, class 4 initial tests only,data.gov.uk, snapshot taken 2026-07-30, released under the Open Government Licence v3.0. Release dvsa-2024-v1. Method: methodology.
MOT failure by fuel type: quick answers
Do electric cars fail their MOT less often than petrol cars?
No. They fail less often in raw numbers — 10.8% against 20.7% — but the electric fleet averages 4.2 years against 10.5 for petrol. Compare cars of the same age and electric fails more: at three years old 9% against 7.1%. Age-adjusted, electric scores 111.1 where 100 is normal for the age.
Why do electric cars fail their MOT?
Tyres, above everything else. Among cars 3–5 years old, electric cars pick up 12.48 tyre defects per 100 tests against 6.99 for petrol — 79% more, at the same age. Electric cars are heavier and deliver torque instantly, and tyres carry that. Every other defect group is lower on electric cars.
Which fuel type passes the MOT most reliably?
Petrol hybrids, and not narrowly: index 70.2 against 97.6 for petrol and 104.6 for diesel. At ten years old hybrids fail 11.9% of tests where petrol fails 21.6%.
Does this mean electric cars are less reliable?
It does not. This measures one thing: the chance of failing a roadworthiness inspection. Breakdown frequency, warranty claims and owner-reported faults are separate measurements that can point the other way, and mixing them is the most common error made with this data.
Related: the worst individual models ·Tesla Model 3 · Nissan Leaf ·Honda e · national statistics + CSV.