Honda e — MOT statistics 2024
The Honda e failed 9.48% of 2,699 first MOT attempts in 2024 ("first-time", excluding retests). Adjusted for the age of the fleet, its initial-failure ratio is 84.6 (100 = expected for its age profile). This car fails its MOT about 15% less often than expected for its age. Small sample — treat with care.
Age-adjusted peer: Audi A4 (index 84.6) — the two published results are 0.0 index points apart.
Honda e common problems: what actually fails the MOT
Lamps, reflectors and electrical equipment stand out at 0.6 per 100 tests, against 23.5 per 100 tests nationally.
higher bar = fails more oftenrate per 100 tests
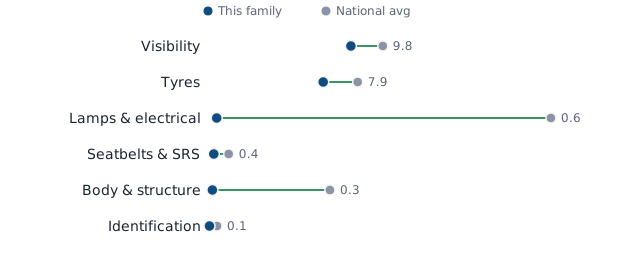
family vs national — top component groups, per 100 tests. Legend: This family · National avg.
Component-group comparison table
| Group | This family | National | Family / national |
|---|---|---|---|
| Visibility | 9.8 | 12.0 | 0.82× |
| Tyres | 7.9 | 10.3 | 0.77× |
| Lamps & electrical | 0.6 | 23.5 | 0.03× |
| Seatbelts & SRS | 0.4 | 1.4 | 0.28× |
| Body & structure | 0.3 | 8.4 | 0.04× |
| Identification | 0.1 | 0.6 | 0.16× |
| What failed | per 100 tests (this family) | per 100 tests (UK average) | ratio family / UK | What to check |
|---|---|---|---|---|
| Wiper blade missing or obviously not clearing the…Wiper blade missing or obviously not clearing the windscreen | 4.45 | 2.18 | 2.05× | Check wipers, washers and windscreen chips in the driver's view |
| Wiper blade defectiveWiper blade defective | 3.56 | 2.04 | 1.75× | Check wipers, washers and windscreen chips in the driver's view |
| Reflector not securely attachedReflector not securely attached | 0.44 | 0.01 | 31.43× | Ask the seller about: Reflector not securely attached |
| Tyre seriously damagedA tyre seriously damaged | 3.71 | 3.29 | 1.13× | Check tyre tread depth across the full width |
| Seat belt buckle missing, damaged or not…Seat belt buckle missing, damaged or not functioning as intended | 0.44 | 0.18 | 2.46× | Ask the seller about: Seat belt buckle missing, damaged or not functioning as inte |
| Tyre pressure monitoring system malfunctioning or…A tyre pressure monitoring system malfunctioning or obviously inoperative | 0.44 | 0.31 | 1.42× | Check tyre tread depth across the full width |
| Tyre cords visible or damagedA tyre cords visible or damaged | 1.26 | 2.00 | 0.63× | Check tyre tread depth across the full width |
| Windscreen washers not working or not providing…Windscreen washers not working or not providing sufficient fluid to clear the windscreen | 1.07 | 2.03 | 0.53× | Check wipers, washers and windscreen chips in the driver's view |
| Tyre tread depth not in accordance with the…Tyre tread depth not in accordance with the requirements | 2.26 | 3.82 | 0.59× | Check tyre tread depth across the full width |
| Windscreen or window damaged or seriously…Windscreen or window damaged or seriously discoloured but not adversely affecting driver's view | 0.52 | 4.27 | 0.12× | Check wipers, washers and windscreen chips in the driver's view |
Named defects ranked by how much more often they appear than the national average — not by raw rate.
Honda e MOT advisories: what gets flagged
Tyres are highest at 118.1 per 100 tests; Suspension is lowest at 0.1 per 100 tests — the gap is 118 per 100 tests.
higher bar = flagged more oftenadvisory items per 100 initial tests
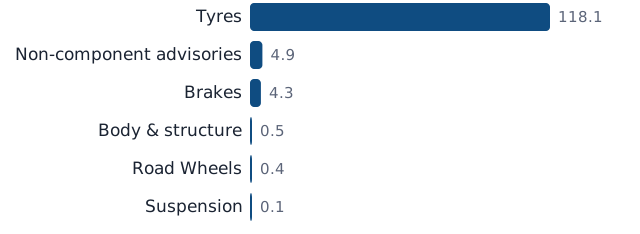
Advisory rates table
| Group | Advisories per 100 |
|---|---|
| Tyres | 118.1 |
| Non-component advisories | 4.9 |
| Brakes | 4.3 |
| Body & structure | 0.5 |
| Road Wheels | 0.4 |
| Suspension | 0.1 |
Advisories are wear the tester noted but didn't fail — what will need money soon.
How does the Honda e perform as it gets older?
At age 4 stands out at 9.0%, against 11.6% for all cars of the same age.
higher = larger sharecompare shares in percentage points
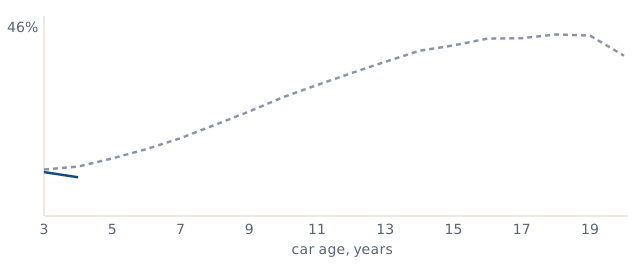
Chart axes: car age, years · failure-rate scale 0–46%.
Takeaway: solid line: this family; dashed: all cars.
Data table
| Age | Honda e | All cars | Gap |
|---|---|---|---|
| 3 | 10.3% | 10.9% | -0.6 pp |
| 4 | 9.0% | 11.6% | -2.5 pp |
Is a Honda e ULEZ compliant?
The share of classifiable 2024 Honda e MOT tests likely ULEZ compliant by first-registration date is 100%.
Based on 2,699 classifiable initial MOT tests. This describes the tested fleet, not a specific car. MOT data do not record Euro class, so likely compliance is inferred from fuel and first-registration date. For the only authoritative answer, check the registration with TfL's official ULEZ checker.
higher = larger share likely compliantinferred from fuel and first-registration date; not a recorded Euro class
| Vehicle age at test | Likely ULEZ-compliant share | Tests |
|---|---|---|
| Under 3 years | Suppressed — sample below publication threshold Check a registration with TfL | n = 27 |
| 3–5 years | 100.0% Check a registration with TfL | n = 2,672 |
| 6–7 years | Suppressed — sample below publication threshold Check a registration with TfL | n = 0 |
| 8 years | Suppressed — sample below publication threshold Check a registration with TfL | n = 0 |
| 9 years | Suppressed — sample below publication threshold Check a registration with TfL | n = 0 |
| 10–14 years | Suppressed — sample below publication threshold Check a registration with TfL | n = 0 |
| 15–17 years | Suppressed — sample below publication threshold Check a registration with TfL | n = 0 |
| 18 years | Suppressed — sample below publication threshold Check a registration with TfL | n = 0 |
| 19 years | Suppressed — sample below publication threshold Check a registration with TfL | n = 0 |
| 20+ years | Suppressed — sample below publication threshold Check a registration with TfL | n = 0 |
How dangerous are Honda e MOT failures?
Major defects stand out at 10.4 per 100 tests, against 63.3 per 100 tests nationally.
higher bar = fails more oftenrate per 100 tests

Severity table
| Severity | This family /100 | National /100 | Family / national |
|---|---|---|---|
| Minor | 4.63 | 24.38 | 0.19× |
| Major | 10.41 | 63.26 | 0.16× |
| Dangerous | 4.19 | 12.89 | 0.33× |
Chart values: Minor 4.6 · Major 10.4 · Dangerous 4.2.
Per 100 tests on this family. National average: Minor 24.4 · Major 63.3 · Dangerous 12.9 per 100.
Does the month of a Honda e MOT matter?
Oct is highest at 15.7%; Jun is lowest at 3.3% — the gap is 12.4 percentage points.
higher = larger sharecompare shares in percentage points
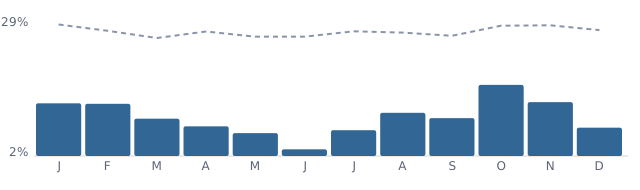
Chart scale: 2%–29%.
bars: Honda e · dashed: all class-4 cars
Month-by-month table
| Month | Honda e | All cars | Gap |
|---|---|---|---|
| Jan | 12.16% | 27.37% | -15.2 pp |
| Feb | 12.07% | 26.14% | -14.1 pp |
| Mar | 9.2% | 24.75% | -15.6 pp |
| Apr | 7.73% | 26.01% | -18.3 pp |
| May | 6.41% | 25.01% | -18.6 pp |
| Jun | 3.3% | 25.01% | -21.7 pp |
| Jul | 6.98% | 26.04% | -19.1 pp |
| Aug | 10.34% | 25.79% | -15.4 pp |
| Sep | 9.31% | 25.19% | -15.9 pp |
| Oct | 15.71% | 27.13% | -11.4 pp |
| Nov | 12.39% | 27.2% | -14.8 pp |
| Dec | 7.45% | 26.29% | -18.8 pp |
Takeaway: the spread between best and worst month is 12.4 percentage points — noticeable seasonality. Seasonality partly reflects registration-date clustering, not weather.
Before reading the shape: most of it is not about cars. Britain changes its registration plates twice a year, and 19.5% of these cars were first registered in March with another17% in September — 37% in two months against the 17% an even spread would give. An MOT falls due three years after first registration, so the buying calendar becomes the testing calendar. Peaks here mark when cars are tested, not when they are worse.
Honda e average mileage by age
At age 4, the middle half of es runs from 10,614 miles to 23,063 miles, against 16,757 miles as the median.
further right = more milesmedian is the typical car; band is p25–p75
line: median · band: middle half of the fleet (p25–p75)
Mileage by age (p25 / median / p75)
| Age | p25 | Median | p75 | Tests |
|---|---|---|---|---|
| 3 | 9,211 | 13,901 | 21,123 | 1,200 |
| 4 | 10,614 | 16,757 | 23,063 | 1,472 |
A typical 4-year-old e has ~16,757 miles on the clock. Much more — ask why; much less — check for gaps in the MOT history.
Honda e ownership: what six years of MOTs show
Odometer anomalies stand out at 0.1%.
higher = larger sharecompare shares in percentage points
Per mile driven, not per year. Dividing failures by the miles that actually went onto the odometers between consecutive tests gives 0.207 failures per 10,000 miles, on a median of 4,020 miles a year across 776 chains. This is the number to compare between models — an annual rate quietly rewards cars that barely leave the drive.
Odometer anomalies: 0.129% of 777 chains show a reading lower than the previous test, with a median drop of 163,084 miles. We call this an anomaly and not fraud on purpose — instrument swaps, imports, unit mix-ups and keying errors all land in the same bucket. Obvious typos (drops under 100 miles or over 90% of the reading) are already excluded.
Honda e MOT: quick answers
Honda e MOT Risk Index stands out at 84.6, against 100 for a car with the same age profile.
below 100 is betterabove 100 is worse100 = normal for this model at that age
- What is the Honda e first-time MOT pass rate?
- 90.52% of first attempts passed in 2024 (2,699 tests). This is the first-time figure: retests after repair are excluded. Basis: first-time, excluding retests.
- Why does this number differ from other sites?
- Other sites often report a pass rate that includes retests or counts all attempts. Our 9.48% figure is the first-time initial failure rate, using 2,699 primary tests as the denominator (first-time, excluding retests). The age-adjusted MOT initial-failure ratio 84.6 is shown separately because raw rates compare fleet age as well as cars.
Compare the Honda e with other cars
Honda Jazz is highest at 85.0; Land Rover Defender is lowest at 84.4 — the gap is 0.6 points.
below 100 is betterabove 100 is worse100 = normal for this model at that age
Same brand
All Honda MOT statisticsHonda Jazz MOT statsHonda CR-V MOT stats
Similar risk
Audi A4 (index 84.6)Land Rover Defender (index 84.4)Honda Jazz (index 85.0)
Same size class
how Nissan Leaf compareshow Tesla Model 3 compareshow Mitsubishi Outlander compares
Data details & how to cite
Scope: class-4 vehicles (cars), initial tests only, outcomes pass / fail / fixed-on-the-spot at the station (PRS counts towards the failure rate — the defect was present at arrival). Index = observed initial failures ÷ failures expected for this fleet's exact age profile, ×100; margin of error is a 95% confidence interval. Covers ALL generations together — a 3-year-old and a 15-year-old are very different cars; a generation split is on the roadmap. Dataset release dataset_release_id=dvsa-2024-v1, frozen baseline; headline claim_id=family-stats:honda-e:dvsa-2024-v1. Full method: methodology.
Cite: MOT Risk Index (2026). Honda e MOT statistics 2024 (dvsa-2024-v1). https://motriskindex.co.uk/cars/honda-e/ · Published 2026-07-30.