Smart Roadster — MOT statistics 2024
The Smart Roadster failed 28.95% of 798 first MOT attempts in 2024 ("first-time", excluding retests). Adjusted for the age of the fleet, its initial-failure ratio is 68.4 (100 = expected for its age profile). This car fails its MOT about 32% less often than expected for its age. Small sample — treat with care.
Age-adjusted peer: Jaguar XJ (index 68.5) — the two published results are 0.1 index points apart.
Smart Roadster common problems: what actually fails the MOT
Suspension is well below the reference at 13.2 per 100 tests, against 32.1 per 100 tests across UK vehicles of the same ages.
higher bar = fails more oftenrate per 100 tests
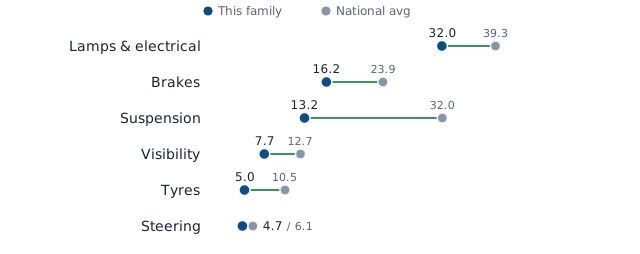
family vs national — matched to UK vehicles of the same ages — top component groups, per 100 tests. Legend: This family · National avg. Combined labels: family / national average. A gap here reflects how these vehicles are driven, used and maintained as well as how they were built — an MOT defect is a test outcome, not a breakdown.
Component-group comparison table
Each ratio carries a 95% interval. With 6 groups compared here, roughly one apparent difference in twenty is chance alone.
| Group | This family | Cases behind it | UK, same ages | Family / national |
|---|---|---|---|---|
| Lamps & electrical | 32.0 | 1,822 | 39.3 | 0.81×0.78–0.85 |
| Brakes | 16.2 | 921 | 23.9 | 0.68×0.63–0.72 |
| Suspension | 13.2 | 754 | 32.0 | 0.41×0.38–0.44 |
| Visibility | 7.7 | 438 | 12.7 | 0.61×0.55–0.67 |
| Tyres | 5.0 | 287 | 10.5 | 0.47×0.42–0.54 |
| Steering | 4.7 | 270 | 6.1 | 0.77×0.68–0.87 |
| What failed | per 100 tests (this family) | per 100 tests (UK average) | ratio family / UK | What to check |
|---|---|---|---|---|
| Lamp emitted colour, position or intensity not in…Lamp emitted colour, position or intensity not in accordance with the requirements | 5.30 | 0.85 | 6.26× | Try every light and switch — lamps are a top failure |
| Brake pipe damaged or excessively corrodedBrake pipe damaged or excessively corroded | 4.26 | 1.41 | 3.03× | Look underneath for rust or cracks around subframe and suspension mountings |
| Audible warning inoperativeAudible warning inoperative | 2.98 | 0.29 | 10.35× | Ask the seller about: Audible warning inoperative |
| Rear registration plate lamp or light source…A rear registration plate lamp or light source missing or inoperative in the case of multiple lamps or light sources | 5.49 | 2.83 | 1.94× | Try every light and switch — lamps are a top failure |
| Headlamp or light source missing, inoperative or…A headlamp or light source missing, inoperative or more than ½ not functioning in the case of LED | 2.32 | 1.24 | 1.86× | Try every light and switch — lamps are a top failure |
| Stop lamp missing, inoperative or in the case of…Stop lamp missing, inoperative or in the case of a multiple light source more than 1/2 not functioning | 2.54 | 1.50 | 1.69× | Try every light and switch — lamps are a top failure |
| Lamp missing, inoperative or in the case of a…A lamp missing, inoperative or in the case of a multiple light source more than 1/2 not functioning | 2.93 | 2.09 | 1.40× | Try every light and switch — lamps are a top failure |
| Wiper blade missing or obviously not clearing the…Wiper blade missing or obviously not clearing the windscreen | 2.42 | 2.22 | 1.09× | Check wipers, washers and windscreen chips in the driver's view |
| Aim of a headlamp is not within limits laid down…The aim of a headlamp is not within limits laid down in the requirements | 2.30 | 2.57 | 0.90× | Try every light and switch — lamps are a top failure |
| Suspension pin, bush or joint excessively wornA suspension pin, bush or joint excessively worn | 3.98 | 4.87 | 0.82× | Listen for knocks over bumps — worn joints show up on the test |
Named defects ranked by how much more often they appear than the national average — not by raw rate.
Smart Roadster MOT advisories: what gets flagged
Brakes are highest at 57.9 per 100 tests; Road Wheels are lowest at 6.9 per 100 tests — the gap is 51.0 per 100 tests.
higher bar = flagged more oftenadvisory items per 100 initial tests
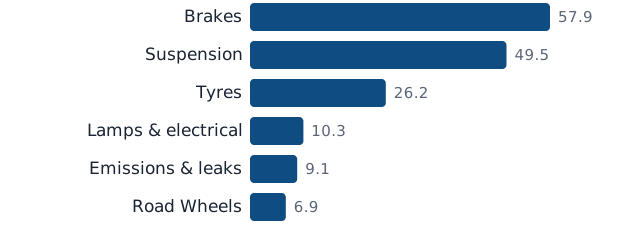
Advisory rates table
| Group | Advisories per 100 |
|---|---|
| Brakes | 57.9 |
| Suspension | 49.5 |
| Tyres | 26.2 |
| Lamps & electrical | 10.3 |
| Emissions & leaks | 9.1 |
| Road Wheels | 6.9 |
Advisories are wear the tester noted but didn't fail — what will need money soon.
If a car like this fails, does it fail again?
A failure rate does not say whether a failure is a one-off or the start of something. This follows the same vehicles into their next ordinary MOT a year later — retests after a repair are excluded, because they follow a failure by definition. 2019-2024.
| After this year's test | Fails next year | Vehicles followed |
|---|---|---|
| It failed | 30.4% | 388 |
| It passed | 25.0% | 2,592 |
A failed test raises next year's chance of failing again by 5.4 percentage points. The failure most likely to come back is lamps, reflectors and electrical equipment — 35.0% of those vehicles fail again next year. Some of this is the vehicle and some is the owner: a car that was let go once tends to be let go again. One caveat: a car that fails may be sold or scrapped rather than tested again, so these figures describe the vehicles that came back.
Adjusted for how much these are actually driven
The headline index adjusts for the fleet's age. Wear, though, follows mileage: a three-year-old taxi and a three-year-old garage queen sit in the same age band. These two rows compare every car with vehicles of the same age, and then with vehicles of the same age and the same annual mileage, 2019-2024, on 5,661 tests. Both stand on the six-year corpus so they are measured on identical data — compare them with each other, not with the headline index above, which is measured on 2024 alone.
| Standardised for | Index | Reading |
|---|---|---|
| Age only | 70.3 | fails less often than expected |
| Age and annual mileage | 77.1 | fails less often than vehicles driven as much |
| Share doing under 3,000 miles a year | 24.3% | a normal spread of use |
Mileage matters here: matching on how much these are driven moves the figure by 6.8 points — this fleet is driven less than the vehicles it is measured against, so the age-only view flatters it — but it does not change which side of normal the car sits on. One limit to keep in mind: mileage is partly a result of how often a car breaks down — one that spends weeks in the workshop covers fewer miles — so the mileage-matched figure can understate a real weakness. Tests with no usable odometer reading are left out of it.
How the Smart Roadster compares with cars of its own age and size
Not against the whole fleet — against cars of the same size class tested at the same age, 2019-2024.
| Age | Smart Roadster | Same class, same age | Difference | Tests |
|---|---|---|---|---|
| 13 years | 32.26% | 43.29% | -11.04 pp | 186 |
| 14 years | 31.34% | 45.87% | -14.53 pp | 568 |
| 15 years | 33.77% | 47.96% | -14.18 pp | 909 |
| 16 years | 30.86% | 50% | -19.14 pp | 972 |
| 17 years | 31.15% | 50.56% | -19.4 pp | 918 |
| 18 years | 29.97% | 50.93% | -20.96 pp | 871 |
| 19 years | 29.3% | 50.39% | -21.09 pp | 727 |
| 20 years | 32.3% | 49.62% | -17.32 pp | 387 |
Raw first-time failure rates within each age, so fleet age cannot flatter either side. A positive difference means this model fails more often than its own class at that age.
How does the Smart Roadster perform as it gets older?
The Roadster at age 18 is well below the reference at 21.1%, against 43.9% for all vehicles of the same age.
higher = larger sharecompare shares in percentage points
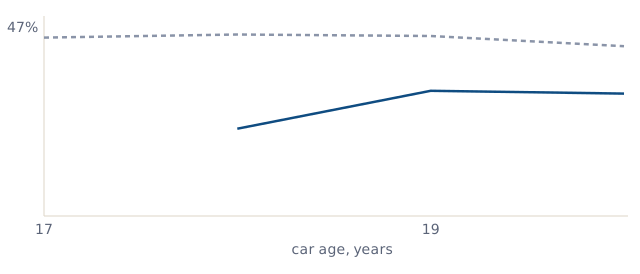
Chart axes: car age, years · failure-rate scale 0–47%.
Takeaway: solid line: this family; dashed: all cars.
Data table
| Age | Smart Roadster | All vehicles | Gap |
|---|---|---|---|
| 18 | 21.1% | 43.9% | -22.8 pp |
| 19 | 30.3% | 43.5% | -13.2 pp |
| 20 | 29.6% | 41.0% | -11.5 pp |
Is a Smart Roadster ULEZ compliant?
The share of classifiable 2024 Smart Roadster MOT tests likely ULEZ compliant by first-registration date is 16.7%.
Based on 792 classifiable initial MOT tests. This describes the tested fleet, not a specific car. MOT data do not record Euro class, so likely compliance is inferred from fuel and first-registration date. For the only authoritative answer, check the registration with TfL's official ULEZ checker.
higher = larger share likely compliantinferred from fuel and first-registration date; not a recorded Euro class
| Vehicle age at test | Likely ULEZ-compliant share | Tests |
|---|---|---|
| Under 3 years | Suppressed — sample below publication threshold Check a registration with TfL | n = 0 |
| 3–5 years | Suppressed — sample below publication threshold Check a registration with TfL | n = 0 |
| 6–7 years | Suppressed — sample below publication threshold Check a registration with TfL | n = 0 |
| 8 years | Suppressed — sample below publication threshold Check a registration with TfL | n = 0 |
| 9 years | Suppressed — sample below publication threshold Check a registration with TfL | n = 0 |
| 10–14 years | Suppressed — sample below publication threshold Check a registration with TfL | n = 2 |
| 15–17 years | Suppressed — sample below publication threshold Check a registration with TfL | n = 22 |
| 18 years | Suppressed — sample below publication threshold Check a registration with TfL | n = 109 |
| 19 years | Suppressed — sample below publication threshold Check a registration with TfL | n = 294 |
| 20+ years | Suppressed — sample below publication threshold Check a registration with TfL | n = 365 |
How dangerous are Smart Roadster MOT failures?
Major defects stand out at 66.1 per 100 tests, against 52.8 per 100 tests nationally.
higher bar = fails more oftenrate per 100 tests

Severity table
| Severity | This family /100 | National /100 | Family / national |
|---|---|---|---|
| Minor | 15.69 | 14.22 | 1.10× |
| Major | 66.12 | 52.75 | 1.25× |
| Dangerous | 6.88 | 11.15 | 0.62× |
Chart values: Minor 15.7 · Major 66.1 · Dangerous 6.9.
Per 100 tests on this family. National average: Minor 14.2 · Major 52.8 · Dangerous 11.2 per 100.
Does the month of a Smart Roadster MOT matter?
Apr is highest at 36.2%; Jun is lowest at 27.9% — the gap is 8.3 percentage points.
higher = larger sharecompare shares in percentage points
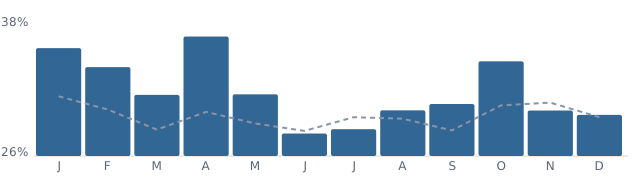
Chart scale: 26%–38%.
bars: Smart Roadster · dashed: all class-4 cars
Month-by-month table
| Month | Smart Roadster | All vehicles | Gap |
|---|---|---|---|
| Jan | 35.25% | 31.12% | +4.1 pp |
| Feb | 33.62% | 29.99% | +3.6 pp |
| Mar | 31.24% | 28.26% | +3.0 pp |
| Apr | 36.24% | 29.78% | +6.5 pp |
| May | 31.29% | 28.79% | +2.5 pp |
| Jun | 27.93% | 28.15% | -0.2 pp |
| Jul | 28.3% | 29.33% | -1.0 pp |
| Aug | 29.92% | 29.2% | +0.7 pp |
| Sep | 30.46% | 28.19% | +2.3 pp |
| Oct | 34.12% | 30.34% | +3.8 pp |
| Nov | 29.9% | 30.58% | -0.7 pp |
| Dec | 29.52% | 29.33% | +0.2 pp |
Takeaway: the spread between best and worst month is 8.3 percentage points — noticeable seasonality. Seasonality partly reflects registration-date clustering, not weather.
Before reading the shape: most of it is not about cars. Britain changes its registration plates twice a year, and 18.9% of these cars were first registered in March with another17.1% in September — 36% in two months against the 17% an even spread would give. An MOT falls due three years after first registration, so the buying calendar becomes the testing calendar. That shapes how many cars are tested each month — not how often they fail: the busiest months here are not the worst ones, so read the failure line on its own and the volume behind it separately.
Smart Roadster average mileage by age
At age 19, the middle half of Roadsters runs from 54,391 miles to 95,267 miles, against 72,589 miles as the median.
further right = more milesmedian is the typical car; band is p25–p75
Does high mileage mean more Smart Roadster MOT failures at the same age?
Within the same age group, split by odometer (2024 MOTs), so this separates wear from age: at ages 15+, 15.1% of those with under 40,000 miles failed first time versus 36.2% of those with 100,000–140,000 miles.Inside this age group, higher mileage goes with more failures.
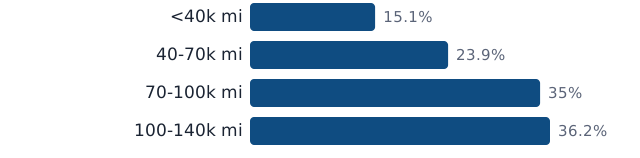
| Age | Odometer | % failing | 95% interval | Tests |
|---|---|---|---|---|
| 15+ | <40k miles | 15.1% | 9.8–22.6% | 119 (rough estimate) |
| 15+ | 40-70k miles | 23.9% | 19.1–29.4% | 264 (rough estimate) |
| 15+ | 70-100k miles | 35% | 29.3–41.2% | 243 (rough estimate) |
| 15+ | 100-140k miles | 36.2% | 28.4–44.9% | 127 (rough estimate) |
line: median · band: middle half of the fleet (p25–p75)
Mileage by age (p25 / median / p75)
| Age | p25 | Median | p75 | Tests |
|---|---|---|---|---|
| 18 | 42,641 | 57,264 | 78,626 | 109 |
| 19 | 54,391 | 72,589 | 95,267 | 294 |
| 20+ | 55,794 | 76,567 | 99,192 | 365 |
A typical 19-year-old Roadster has ~72,589 miles on the clock. Much more — ask why; much less — check for gaps in the MOT history.
Where in Britain the Smart Roadster fails its MOT most
Too few tests in any single postcode area to name one, so this is the wider picture across 5,699 tests, 2019-2024.
| Part of Britain | % failing | Tests |
|---|---|---|
| Scotland | 36.84% | 437 |
| Midlands | 32.17% | 1,632 |
| Wales | 31.98% | 197 |
| Southern England | 30.23% | 2,716 |
| Northern England | 30.07% | 715 |
Raw pass/fail rates, not age-adjusted: fleets differ by region. England is split north of Sheffield, between Sheffield and Oxford, and south of it.
How many miles does a Smart Roadster last?
100,000+ miles stands out at 18.4%.
higher = larger sharecompare shares in percentage points
| Odometer | Tests ≥ threshold | Share of sample |
|---|---|---|
| 100,000+ miles | 1,042 | 18.4% |
Of 5,664 tests of this family with a usable odometer in 2024, 18.4% had reached 100k miles. This is a cross-section of cars still presenting for MOT, not a full birth cohort.
Smart Roadster faults that come together
Emissions & leaks + Visibility stand out at 4.70×, against 1.00× if the faults were independent.
above 1.0× = more than expectedbelow 1.0× = less
| Group A | Group B | Together | Lift |
|---|---|---|---|
| Noise, emissions and leaks | Visibility | 49 | 4.7× (rough estimate) |
| Steering | Suspension | 85 | 4.51× (rough estimate) |
| Body, chassis, structure | Noise, emissions and leaks | 23 | 4.5× (rough estimate) |
| Lamps, reflectors and electrical equipment | Seat belts and supplementary restraint systems | 56 | 3.8× (rough estimate) |
| Brakes | Seat belts and supplementary restraint systems | 28 | 3.59× (rough estimate) |
| Brakes | Noise, emissions and leaks | 53 | 3.46× (rough estimate) |
| Body, chassis, structure | Lamps, reflectors and electrical equipment | 103 | 3.16× (rough estimate) |
| Body, chassis, structure | Visibility | 36 | 3.07× (rough estimate) |
| Noise, emissions and leaks | Suspension | 44 | 2.97× (rough estimate) |
| Body, chassis, structure | Brakes | 51 | 2.96× (rough estimate) |
| Lamps, reflectors and electrical equipment | Noise, emissions and leaks | 85 | 2.94× (rough estimate) |
| Brakes | Tyres | 58 | 2.93× (rough estimate) |
| Brakes | Suspension | 145 | 2.91× (rough estimate) |
| Tyres | Visibility | 39 | 2.9× (rough estimate) |
| Brakes | Lamps, reflectors and electrical equipment | 275 | 2.82× (rough estimate) |
| Brakes | Visibility | 95 | 2.71× (rough estimate) |
| Lamps, reflectors and electrical equipment | Visibility | 179 | 2.7× (rough estimate) |
| Lamps, reflectors and electrical equipment | Tyres | 101 | 2.7× (rough estimate) |
| Seat belts and supplementary restraint systems | Suspension | 20 | 2.65× (rough estimate) |
| Suspension | Visibility | 87 | 2.56× (rough estimate) |
| Body, chassis, structure | Suspension | 40 | 2.4× (rough estimate) |
| Lamps, reflectors and electrical equipment | Suspension | 222 | 2.36× (rough estimate) |
| Suspension | Tyres | 44 | 2.3× (rough estimate) |
| Steering | Visibility | 30 | 2.26× (rough estimate) |
| Lamps, reflectors and electrical equipment | Steering | 83 | 2.25× (rough estimate) |
| Brakes | Steering | 39 | 2× (rough estimate) |
| Seat belts and supplementary restraint systems | Visibility | 17 | too few (rough estimate) |
| Noise, emissions and leaks | Tyres | 17 | too few (rough estimate) |
| Body, chassis, structure | Steering | 17 | too few (rough estimate) |
| Body, chassis, structure | Tyres | 16 | too few (rough estimate) |
| Steering | Tyres | 16 | too few (rough estimate) |
| Body, chassis, structure | Seat belts and supplementary restraint systems | 12 | too few (rough estimate) |
| Noise, emissions and leaks | Steering | 11 | too few (rough estimate) |
| Noise, emissions and leaks | Seat belts and supplementary restraint systems | 10 | too few (rough estimate) |
| Identification of the vehicle | Lamps, reflectors and electrical equipment | 10 | too few (rough estimate) |
| Lamps, reflectors and electrical equipment | Road Wheels | 9 | too few (rough estimate) |
| Seat belts and supplementary restraint systems | Tyres | 9 | too few (rough estimate) |
| Body, chassis, structure | Identification of the vehicle | 7 | too few (rough estimate) |
| Brakes | Road Wheels | 7 | too few (rough estimate) |
| Brakes | Identification of the vehicle | 6 | too few (rough estimate) |
| Identification of the vehicle | Visibility | 5 | too few (rough estimate) |
Defects in «Noise, emissions and leaks» and «Visibility» appear together 4.70× more often than chance (49 co-occurrences in the same test; 78 pairs compared).
Lift = how many times more often both groups appear on the same test than if independent. A pair is listed from 5 tests with both faults; the lift is shown from 20, and called above chance only when its 95% interval excludes 1 (see rough estimates).
Is low mileage better for a Smart Roadster?
Cars driven under 5,000 miles a year stands out at 27.7%, against 23.1% for cars driven 8,000–12,000 miles a year.
higher = larger sharecompare shares in percentage points
| Band | Fail % | Tests |
|---|---|---|
| <5k miles/year | 27.73% | 339 |
| 8–12k miles/year | 23.08% | 39 |
| Gap (low − normal) | +4.65 pp | — |
By fuel and age
Petrol
| Age | Low-use fail % | n | Normal fail % | n | Gap pp |
|---|---|---|---|---|---|
| 14 | 27.51 | 338 | 23.08 | 39 | +4.44 pp |
At matched ages 5–14, cars averaging under 5k miles/year fail at 27.7% vs 23.1% for 8–12k miles/year — 4.7 pp, interval includes no difference (n_low=339, n_normal=39). The gap interval includes no difference, so no higher/lower claim is made.
Smart Roadster MOT repair costs
The MOT-failure repair budget per test runs from £97.36 to £184.98, against £54.85 for the test itself.
bigger number = costs morepounds per test, MOT-failing faults only
| Component | Fails per 100 tests | Typical repair | Its price | Contribution |
|---|---|---|---|---|
| Lamps, reflectors and electrical equipment | 32.0 (nat. 18.09) | Battery replacement (standard 12V lead-acid) | £140 | £44.80 |
| Brakes | 16.2 (nat. 11.25) | Front brake pads (parts + labour, typical hatchback) | £150 | £24.30 |
| Suspension | 13.2 (nat. 15.36) | Suspension coil spring (single corner) | £180 | £23.76 |
| Tyres | 5.0 (nat. 8.7) | Tyre (single mid-range 16" fitted) | £90 | £4.50 |
Multiply how often each component fails on this model by what that repair usually costs, and you get the amount an owner should expect to budget per test for MOT-failing faults only — roughly £97 to £185, on top of the test fee itself. It is a budgeting figure, not a quote: the spread between a set of pads and a set of discs is most of the range.
Prices are modal quotes from a hand-kept catalogue of published UK garage guides — we do not scrape the booking sites, their terms forbid it, so this list is short and updated by hand with a source and date against each line. Each line prices one typical repair in that group, not a full remedy, and only groups our catalogue actually covers are counted. The contrast worth noticing is the second card: the legal maximum for the test has been £54.85 since 2010, while the repairs it uncovers have followed inflation the whole time.
For scale from a different direction: Warrantywise, which sees used-car warranty claims rather than test failures, puts the average claim at £2,052 across the ten highest-claim models it ranks and £539 for Honda, the lowest-claim make in its index (Warrantywise index 2026, 1.6 million claims, cars aged 3–15). Those sit an order of magnitude above the figures in this table, and the gap is the point: a warranty claim is a gearbox or an engine, which almost never fails an MOT, while the faults that do fail one are corrosion, lamps and tyres, which no warranty pays for. The two numbers answer different questions and neither replaces the other.
Smart Roadster running costs for a fleet
Vehicles failing at age 19 stand out at 30.0%, against 21.0% at age 18, tested in the same year.
higher = larger sharecompare shares in percentage points
Failure rate and typical odometer by age
| Age | Fails | Median odometer | Tests | Gap vs age 5 |
|---|---|---|---|---|
| 18 | 21.1% | 57,264 | 109 | — |
| 19 | 30.27% | 72,589 | 294 | — |
No single year stands out as the point where this model starts costing more: the year-to-year steps in its failure rate are too small or rest on too few tests to name one (D1 rule: a step is named only with at least 2,000 tests on both sides and a jump above 3 percentage points).
Repair spend uses the same modal prices as the section above, so it inherits the same limits: one typical repair per component group, not a full remedy. Downtime is the gap between the failed test and the passed re-test, which is the window a vehicle is legally off the road.
Smart Roadster rust problems: where they corrode
Age-standardised corrosion susceptibility stands out at 20.11×, against 1.00× for the national age-standardised rate.
above 1.0× = rusts more than averagebelow 1.0× = rusts less
This Smart Roadster fails on corrosion far more often than average once age is held constant, and its owners live in areas that are about typical for the models we publish.
Corrosion is the one failure mode that is as much about geography as about the car. We keep the two apart on purpose: a model can look rusty simply because it is popular in Scotland, and a model can look clean simply because it is bought in Surrey. Blending them into a single score would hide which of the two is doing the work.
Exposure is this model's tests weighted by an area corrosion index built from frost days, salt load and distance to the coast — the composite validated at r = 0.42 against corrosion defects we actually record. It is published as a rank, not a raw score, because every mainstream model skews towards low-corrosion areas for the simple reason that most of Britain's cars are in the south. Susceptibility is standardised to the national age profile, so an old fleet does not get labelled a rusty model.
Does a Smart Roadster advisory become a failure?
Brakes are highest at 12.7%; Tyres are lowest at 5.8% — the gap is 6.9 percentage points.
higher = more likelypercentage is the observed transition probability
chance the same component fails at the next MOT, given an advisory now

| Component | Fails next time | Typical lead time | Miles of warning | Advisories tracked |
|---|---|---|---|---|
| Brakes | 12.7% | 12.1 months | 1,626 | 1,291 |
| Suspension | 12.4% | 12 months | 1,659 | 1,033 |
| Tyres | 5.8% | 12.2 months | 3,137 | 660 |
This is the question an advisory note actually raises, and it needs six years of test history to answer. We followed the same vehicles from one MOT to the next across 2019–2024 and measured how often a component that was merely advised came back as a genuine failure at the next test.
Read it as a budgeting horizon, not a prophecy: the most likely component above turns into a failure for about 13 in 100 cars, and the median gap is 12.1 months and roughly 1,626 miles. The rest were repaired, sold, scrapped, or simply held. Rows with fewer than 500 tracked advisories are not shown.
What will fail next on a Smart Roadster?
Lamps, reflectors and electrical equipment after a failure at age 15-19 are highest at 24.4%; Brakes after a passed at age 15-19 are lowest at 5.8% — the gap is 18.7 percentage points.
higher = more likelypercentage is the observed transition probability
| Age | Last test | Most likely next failures | Cars tracked |
|---|---|---|---|
| 12-14 | passed | Lamps, reflectors and electrical equipment 14.8% · Brakes 7.5% · Suspension 6.4% | 466 (rough estimate) |
| 12-14 | advisory | Lamps, reflectors and electrical equipment 14.9% · Brakes 10.1% · Suspension 9.4% | 308 (rough estimate) |
| 12-14 | failure | Lamps, reflectors and electrical equipment 19.7% · Suspension 12.1% · Brakes 11.5% | 340 (rough estimate) |
| 15-19 | passed | Lamps, reflectors and electrical equipment 12.4% · Brakes 5.8% · Suspension 5.8% | 1,162 |
| 15-19 | advisory | Lamps, reflectors and electrical equipment 18.2% · Suspension 9.6% · Brakes 9.3% | 1,054 |
| 15-19 | failure | Lamps, reflectors and electrical equipment 24.4% · Suspension 11.5% · Brakes 11.3% | 1,007 |
The same chains, cut differently: given a car's age and how its last test went, which component most often causes trouble at the following one.
The pattern that repeats across every family: a failure at one test roughly doubles the chance of a failure on the same component at the next one, and an advisory sits about half-way between a clean pass and a failure. Age bands in years; probabilities are per car, not per defect item.
Smart Roadster ownership: what six years of MOTs show
The ten-day re-test pass rate is highest at 66.2%; The later re-test pass rate is lowest at 5.9% — the gap is 60.2 percentage points.
higher = larger sharecompare shares in percentage points
Failing is usually a same-week event, not a disaster. Of 1,229 failures followed through to their re-test, 27.91% were repaired and passed the same day and 66.15% within ten days; the median gap is 2 days. 3,414 defect items were cleared in the process.
Per mile driven, not per year. Dividing failures by the miles that actually went onto the odometers between consecutive tests gives 1.19 failures per 10,000 miles, on a median of 1,210 miles a year across 1,170 chains. This is the number to compare between models — an annual rate quietly rewards cars that barely leave the drive.
Two populations hide inside one model. 31.6% of these cars strung together three or more tests with nothing recorded at all, while 38.62% carried the same advisory three times or more — the same fault, noted, ignored, noted again. When you buy used you are buying one of those two histories, and the MOT record shows which.
Odometer anomalies: 1.366% of 1,171 chains show a reading lower than the previous test, with a median drop of 11,530 miles. We call this an anomaly and not fraud on purpose — instrument swaps, imports, unit mix-ups and keying errors all land in the same bucket. Obvious typos (drops under 100 miles or over 90% of the reading) are already excluded.
Smart Roadster MOT: quick answers
Smart Roadster MOT Risk Index is well below the reference at 68.4, against 100 for a car with the same age profile.
below 100 is betterabove 100 is worse100 = normal for this model at that age
- What is the Smart Roadster first-time MOT pass rate?
- 71.05% of first attempts passed in 2024 (798 tests). This is the first-time figure: retests after repair are excluded. Basis: first-time, excluding retests.
- Why does this number differ from other sites?
- Other sites often report a pass rate that includes retests or counts all attempts. Our 28.95% figure is the first-time initial failure rate, using 798 primary tests as the denominator (first-time, excluding retests). The age-adjusted MOT initial-failure ratio 68.4 is shown separately because raw rates compare fleet age as well as cars.
Compare the Smart Roadster with other cars
Jaguar XJ is highest at 68.5; Volkswagen e-up is lowest at 67.9 — the gap is 0.6 points.
below 100 is betterabove 100 is worse100 = normal for this model at that age
Same brand
All Smart MOT statisticsSmart Roadster MOT statsSmart Fortwo MOT stats
Similar risk
Jaguar XJ (index 68.5)Mercedes-Benz S (index 68.0)Volkswagen e-up (index 67.9)
Same size class
how Bentley Turbo compareshow Fiat Coupe compareshow Nissan 200 compares
By build year
Smart Roadster 2005Smart Roadster 2006
By area
Smart Roadster MOT failure rate by postcode area
By failure group
Smart Roadster body, chassis and structure failuresSmart Roadster brakes failuresSmart Roadster lamps, reflectors and electrics failuresSmart Roadster noise, emissions and leaks failuresSmart Roadster seat belts and airbags failuresSmart Roadster steering failuresSmart Roadster suspension failuresSmart Roadster tyres failuresSmart Roadster visibility failures
Data details & how to cite
Scope: class-4 vehicles (cars), initial tests only, outcomes pass / fail / fixed-on-the-spot at the station (PRS counts towards the failure rate — the defect was present at arrival). Index = observed initial failures ÷ failures expected for this fleet's exact age profile, ×100; margin of error is a 95% confidence interval. Covers ALL generations together — a 3-year-old and a 15-year-old are very different cars; a generation split is on the roadmap. Dataset release dataset_release_id=dvsa-2024-v2, frozen baseline; headline claim_id=family-stats:smart-roadster-review-7a5000ac:dvsa-2024-v2. Full method: methodology.
Cite: MOT Risk Index (2026). Smart Roadster MOT statistics 2024 (data release dvsa-2024-v2; downloadable dataset motriskindex-families-2024-v5, doi:10.5281/zenodo.22975051). https://motriskindex.co.uk/cars/smart-roadster-review-7a5000ac/ · Published 2026-07-30.