Which car brand fails its MOT most?
Dacia has the worst record of the 32 brands big enough to measure — index 141.8, meaning it fails roughly42% more often than cars of the same age, across 268,902 tests. At the other end, Porsche scores 39.1. Every number here is age-adjusted, because the raw league table measures how old a brand's cars are rather than how they hold up.
The ten worst brands, adjusted for the age of their cars
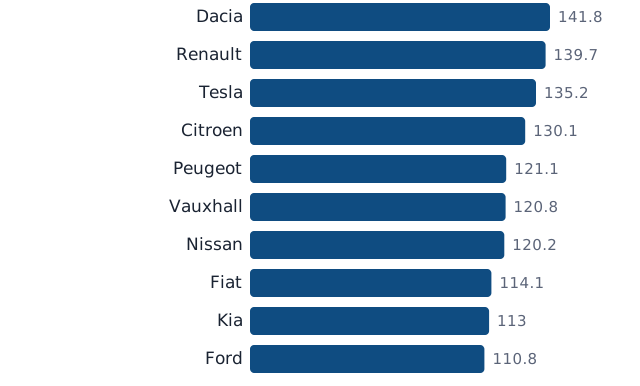
MOT Risk Index by brand, worst ten. 100 = normal failure rate for the car's age.
| # | Brand | Index | 95% interval | Raw % failing | Average age | Tests | Most common failure |
|---|---|---|---|---|---|---|---|
| 1 | Dacia | 141.8 | 140.6–142.9 | 20.8% | 6.8 yrs | 268,902 | Lamps, reflectors and electrical equipment (15.04 per 100) |
| 2 | Renault | 139.7 | 139.3–140.1 | 30.4% | 10.6 yrs | 1,445,855 | Lamps, reflectors and electrical equipment (37.5 per 100) |
| 3 | Tesla | 135.2 | 133.3–137.1 | 12.9% | 4.3 yrs | 151,221 | Tyres (21.38 per 100) |
| 4 | Citroen | 130.1 | 129.7–130.5 | 28.3% | 10.4 yrs | 1,451,949 | Lamps, reflectors and electrical equipment (40.17 per 100) |
| 5 | Peugeot | 121.1 | 120.8–121.4 | 25.9% | 10.4 yrs | 2,065,391 | Lamps, reflectors and electrical equipment (37.45 per 100) |
| 6 | Vauxhall | 120.8 | 120.6–121.1 | 26.5% | 10.5 yrs | 4,284,528 | Lamps, reflectors and electrical equipment (28.05 per 100) |
| 7 | Nissan | 120.2 | 119.9–120.5 | 25.1% | 10 yrs | 2,409,685 | Suspension (27.97 per 100) |
| 8 | Fiat | 114.1 | 113.7–114.5 | 25.7% | 10.9 yrs | 1,172,923 | Lamps, reflectors and electrical equipment (27.2 per 100) |
| 9 | Kia | 113.0 | 112.6–113.4 | 19.9% | 8.2 yrs | 1,413,480 | Brakes (16.55 per 100) |
| 10 | Ford | 110.8 | 110.6–111 | 23.6% | 10.2 yrs | 6,612,857 | Lamps, reflectors and electrical equipment (28.03 per 100) |
Where the raw league table lies hardest
Honda looks like one of the safest bets and is one of the worst. Only 20.6% of its tests end in failure, which places it 19th of 32 on raw numbers. But its cars average 12.2 years old, and cars that young are supposed to pass almost everything. Measured against that expectation it falls to 9th — a drop of 10 places caused entirely by taking age into account.
The ten best brands
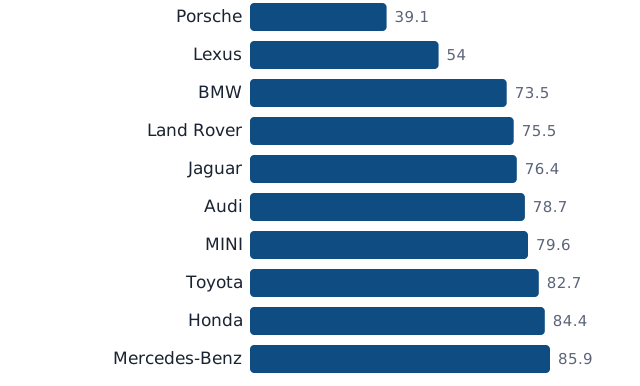
MOT Risk Index by brand, best ten. Lower is better; 100 = normal for the car's age.
| # | Brand | Index | 95% interval | Raw % failing | Average age | Tests | Most common failure |
|---|---|---|---|---|---|---|---|
| 1 | Porsche | 39.1 | 38.7–39.5 | 8.2% | 11 yrs | 436,688 | Lamps, reflectors and electrical equipment (13.41 per 100) |
| 2 | Lexus | 54.0 | 53.4–54.6 | 11.1% | 10.1 yrs | 265,728 | Lamps, reflectors and electrical equipment (12.66 per 100) |
| 3 | BMW | 73.5 | 73.3–73.7 | 14.6% | 9.6 yrs | 3,501,379 | Lamps, reflectors and electrical equipment (13.56 per 100) |
| 4 | Land Rover | 75.5 | 75.2–75.8 | 15.3% | 10.2 yrs | 1,953,398 | Suspension (19.15 per 100) |
| 5 | Jaguar | 76.4 | 75.9–76.8 | 14.9% | 9.8 yrs | 692,161 | Suspension (23.7 per 100) |
| 6 | Audi | 78.7 | 78.4–78.9 | 15.5% | 9.4 yrs | 3,063,306 | Suspension (14.83 per 100) |
| 7 | MINI | 79.6 | 79.3–80 | 16.4% | 10 yrs | 1,350,160 | Lamps, reflectors and electrical equipment (22.99 per 100) |
| 8 | Toyota | 82.7 | 82.4–82.9 | 17.7% | 10.7 yrs | 2,508,214 | Lamps, reflectors and electrical equipment (25.11 per 100) |
| 9 | Honda | 84.4 | 84.1–84.7 | 20.6% | 12.2 yrs | 1,375,064 | Lamps, reflectors and electrical equipment (33.96 per 100) |
| 10 | Mercedes-Benz | 85.9 | 85.7–86.1 | 16.4% | 9.4 yrs | 3,116,844 | Suspension (18.28 per 100) |
Every brand we can measure
| Rank | Brand | Index | 95% interval | Raw % failing | Rank on raw numbers | Average age | Tests |
|---|---|---|---|---|---|---|---|
| 1 | Porsche | 39.1 | 38.7–39.5 | 8.2% | 1 | 11 yrs | 436,688 |
| 2 | Lexus | 54.0 | 53.4–54.6 | 11.1% | 2 | 10.1 yrs | 265,728 |
| 3 | BMW | 73.5 | 73.3–73.7 | 14.6% | 4 | 9.6 yrs | 3,501,379 |
| 4 | Land Rover | 75.5 | 75.2–75.8 | 15.3% | 6 | 10.2 yrs | 1,953,398 |
| 5 | Jaguar | 76.4 | 75.9–76.8 | 14.9% | 5 | 9.8 yrs | 692,161 |
| 6 | Audi | 78.7 | 78.4–78.9 | 15.5% | 8 | 9.4 yrs | 3,063,306 |
| 7 | MINI | 79.6 | 79.3–80 | 16.4% | 9 | 10 yrs | 1,350,160 |
| 8 | Toyota | 82.7 | 82.4–82.9 | 17.7% | 11 | 10.7 yrs | 2,508,214 |
| 9 | Honda | 84.4 | 84.1–84.7 | 20.6% | 19 | 12.2 yrs | 1,375,064 |
| 10 | Mercedes-Benz | 85.9 | 85.7–86.1 | 16.4% | 10 | 9.4 yrs | 3,116,844 |
| 11 | Smart | 93.7 | 92.6–94.9 | 20.9% | 21 | 11 yrs | 113,718 |
| 12 | Suzuki | 95.6 | 95–96.1 | 20.1% | 17 | 10.3 yrs | 614,767 |
| 13 | Skoda | 98.5 | 98–98.9 | 18.4% | 12 | 8.9 yrs | 1,130,490 |
| 14 | Volkswagen | 98.6 | 98.4–98.8 | 21.0% | 22 | 10.5 yrs | 4,831,510 |
| 15 | Volvo | 99.9 | 99.4–100.3 | 19.9% | 14 | 9.7 yrs | 939,679 |
| 16 | MG | 100.0 | 98.8–101.1 | 15.3% | 7 | 8.2 yrs | 185,471 |
| 17 | Mazda | 100.5 | 100–100.9 | 22.1% | 24 | 10.9 yrs | 799,313 |
| 18 | Mitsubishi | 100.9 | 100.3–101.5 | 21.5% | 23 | 10.6 yrs | 459,364 |
| 19 | Jeep | 104.0 | 102.6–105.3 | 19.9% | 16 | 9.6 yrs | 119,686 |
| 20 | Alfa Romeo | 105.5 | 104.3–106.7 | 24.9% | 26 | 11.5 yrs | 117,133 |
| 21 | Hyundai | 107.4 | 107–107.8 | 20.3% | 18 | 8.8 yrs | 1,293,481 |
| 22 | SEAT | 108.9 | 108.4–109.4 | 19.7% | 13 | 8.5 yrs | 863,736 |
| 23 | Ford | 110.8 | 110.6–111 | 23.6% | 25 | 10.2 yrs | 6,612,857 |
| 24 | Kia | 113.0 | 112.6–113.4 | 19.9% | 15 | 8.2 yrs | 1,413,480 |
| 25 | Fiat | 114.1 | 113.7–114.5 | 25.7% | 28 | 10.9 yrs | 1,172,923 |
| 26 | Nissan | 120.2 | 119.9–120.5 | 25.1% | 27 | 10 yrs | 2,409,685 |
| 27 | Vauxhall | 120.8 | 120.6–121.1 | 26.5% | 30 | 10.5 yrs | 4,284,528 |
| 28 | Peugeot | 121.1 | 120.8–121.4 | 25.9% | 29 | 10.4 yrs | 2,065,391 |
| 29 | Citroen | 130.1 | 129.7–130.5 | 28.3% | 31 | 10.4 yrs | 1,451,949 |
| 30 | Tesla | 135.2 | 133.3–137.1 | 12.9% | 3 | 4.3 yrs | 151,221 |
| 31 | Renault | 139.7 | 139.3–140.1 | 30.4% | 32 | 10.6 yrs | 1,445,855 |
| 32 | Dacia | 141.8 | 140.6–142.9 | 20.8% | 20 | 6.8 yrs | 268,902 |
What this means if you are buying
Do not read the raw failure rate off a brand and stop there. A young fleet flatters a brand twice over: fewer failures now, and a reputation built on those numbers.
Check the failure category, not just the score. Brands at the same index fail for different reasons, and wear items are cheap where structural corrosion is not.
The brand is the weakest useful unit here. Individual models inside one brand differ more than brands differ from each other — the model page is the number that should decide a purchase.
Where this number stops applying
This is inspection risk, not breakdown risk. A brand with a reputation for expensive mechanical trouble can still pass MOTs better than its age predicts, because the test checks roadworthiness items rather than drivetrain durability — and several brands in the best ten are exactly that case. Three further limits: brands are taken as written in the test record, so marques are not merged into their parent groups; only brands with at least100,000 initial tests appear, which leaves out small importers; and where the confidence interval crosses 100 the brand is shown without a colour verdict, because the data cannot separate it from normal.
Source: DVSA anonymised MOT tests and results, calendar 2024, class 4 initial tests only,data.gov.uk, snapshot taken 2026-07-30, Open Government Licence v3.0. National raw failure rate across all52,245,582 tests: 20.8%. Release dvsa-2024-v1. Method: methodology.
MOT failure by brand: quick answers
Which car brand fails its MOT most in the UK?
Dacia, once you correct for the age of the cars: index 141.8 against a national norm of 100, across 268,902 initial tests. Second and third are Renault (139.7) and Tesla (135.2).
Which car brand passes its MOT most reliably?
Porsche: index 39.1, meaning it fails roughly 61% less often than cars of the same age. Lexus follows at 54.0 and BMW at 73.5.
Why does the raw failure rate give a different answer?
Because it ranks fleet age, not cars. Honda is the clearest case: 20.6% of its tests fail, which puts it 19th of 32 on raw numbers, but its cars average only 12.2 years old. Judged against what is normal at that age it ranks 9th.
Does a good MOT record mean the brand is reliable?
Not by itself. The MOT measures whether a car meets roadworthiness standards on the day, so it is dominated by wear items — tyres, brakes, suspension, lamps. A brand can pass inspections well and still break down often, or the reverse. Treat this as one measurement, not a verdict on the brand.
Related: do electric cars fail their MOT less ·the worst individual models ·the most reliable models ·every model we cover ·national statistics + CSV.